· Richard Webber · Articles · 23 min read
Will 2029 see the emergence of successful faith-based political parties in Westminster
Using the Origins Classification to examine the influence of Ethnicity of the results of the UK 2024 General Election.

Introduction
It was not until 1987 that four representatives of Britain’s minorities, Diane Abbott, Paul Boateng, Bernie Grant and Keith Vaz, first made a visible difference to the appearance of the House of Commons. As Diane Abbot explained on her election as Member of Parliament for Hackney North, a black woman in the corridors of Parliament would be mistaken for a cleaner, such were the stereotypical assumptions of fellow Members at that time. Since 1987 the benches of the Commons have gradually become more representative of the diverse communities that now comprise the British population, from four MPs in 1987 to 65 in 2019. This is testament to the commitment of the mainstream parties to encourage members of non white British communities to stand for election and for constituency adoption panels to select them whether as local council or as parliamentary candidates.
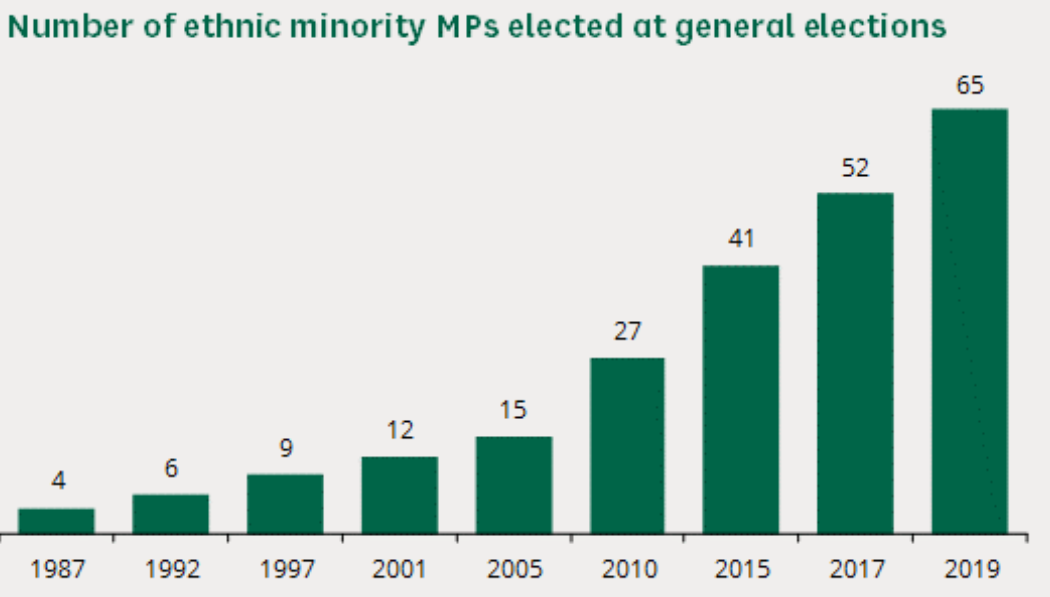
Table one: number of ethnic minority MPs elected at general elections
Or so we are led to understand. Others might argue that early post war parliaments were also diverse, albeit been diverse in rather different ways. Though no members of the 1945 parliament bore other than white European names 22 of its members bore names of continental European origin, 20 of Republic of Ireland heritage and a ten a distinctively Jewish name. As in the 1987 and more subsequent elections it was on the Labour benches that the majority of MPs with non British names were seated. All ten of the MPs with distinctively Jewish names were elected for Labour, many but by no means all of them representing constituencies with substantial Jewish populations.
Since 1987 the campaign to broaden the composition of the House of Commons was based on an assumption, largely unchallenged until 2024, that the interests of minority communities would better achieved from within the existing mainstream parties than through the formation of a distinctively community or faith based party such as the Scottish National Party, Plaid Cymru or Sinn Fein in the UK or Germany’s Christian Democrats.
What may in time be considered to be one of the most significant outcomes of the 2024 UK General Election is the challenge its results gave of this assumption. Undoubtedly the most memorable headline of the night was that Labour had gained 217 Labour seats. This was achieved despite losing four seats, Birmingham Perry Barr, Blackburn, Dewsbury and Batley and Leicester East to independent candidates, each campaigning on a platform specifically addressing the concerns of the non white British electorates of which they were members.
Perhaps it is fortunate for Labour that all four of these campaigns were waged by candidates unaffiliated to any party. Subsequent to their election the four MPs have met with Jeremy Corbyn to agree some level of co-ordination of their parliamentary activities. We can not therefore rule out the possibility of the 2029 General Election being contested by candidates standing for a party specifically targeting its campaign at minority populations in seats with large numbers of electors of non white British heritage.
Clearly it was the Labour Party’s policy on Gaza that contributed to the election of these four independent MPs and a resolution of the Middle East conflict or a change in Labour policy towards Israel may return these four seats to Labour. However by 2029 the growing number of seats where minority populations themselves form a majority combined with the growing self-confidence and engagement of minority communities with the political process could result in the entrance of a new faith-based party and increase even further the choices open to electors.
The purpose of this paper is to examine a number of issues surrounding diversity and the results of the 2024 General Election. Are members of minority communities still under-represented at Westminster? Does the culture of some communities dispose their members to stand for parliament more than others? Were they more or less disposed to stand for mainstream parties, as Independents or for other parties? For which mainstream parties were they most likely to stand? And for each mainstream party did the substantial presence of a particular minority result in a better or worse local performance bearing in mind their performance in the equivalent seats in 2019?
Our exploration of these questions relies on access to two data sets, a database of seats and members published by the House of Commons library and the Origins ethno-cultural classification.
The database published by the House of Commons library contains a full set of results of each GB constituency, including the names, party affiliations and vote shares of each candidate in 2024. To address the effect of the redrawing of constituency boundaries between 2019 and 2024 it also contains estimates of the share of the vote each party is likely to have won in each seat were the election to have fought on previous boundaries..
The Origins classification is a tool used to infer heritage from a combination of personal and family name. It is used in this study to infer the socio-cultural heritage of each candidate and the socio-cultural make up of the electorate of each 2024 constituency.
Inferring members’ heritage
Origins is a system of classification which uses personal and family names to infer the cultural heritage into which a person is most likely to have been born. The system relies on a pair of reference files which associate each personal name and each family name with one of over 200 different socio-cultural groupings.
The system was first developed by OriginsInfo.Ltd in 2006 and is currently distributed by Webber Phillips Ltd.
Using the system it is possible to identify under- or over-represented groups by comparing the names of members of any particular sub-group with those of the adult population of the UK. This comparison is based on the relative frequency of the names of the population sub group.
The classification has numerous advantages over the use of self-response. It identifies the presence of more different communities; they are more precisely defined; the classifications is objective, in that it based on ancestral heritage, the community a person grew up in, rather than subjective, based on the community the person would like to be associated with with or treated as though they belonged to; the classification can be applied consistently to compare different populations. The system can typically be applied to 99.8% of a population, significantly higher than the response rate of a self-identification question on a typical survey. Finally the classification can be applied to historical databases for which it would not otherwise be possible to derive an ethnicity code.
The principal current uses of Origins lie primarily in relation to diversity and equalities are within policing, local government, health and beauty, financial services, recruitment and the targeting of political and charitable campaigns.
It was by profiling the Members of the 1945 parliament that we were able to infer that the country did not return a single non-white MP, that people of Jewish origin were so well represented and that people of non-English heritage were so disproportionately represented on the Labour benches.
| Conservative | Labour | |
|---|---|---|
| MPs, main parties | 181 | 387 |
| MPs by Origins | ||
| English | 136 | 254 |
| Scottish | 29 | 49 |
| Welsh | 8 | 40 |
| Republic of Ireland | 3 | 17 |
| Continental European | 5 | 17 |
| Jewish | 0 | 10 |
Table two: MPs by grouped Origins code, 1945
The representativeness of candidates
The Origins classification associates some six million different personal and family names with one of over 200 different Origins types which, for the sake of convenience, are rolled up into a set of 49 sub groups and 12 groups. Given the population size of the party candidate database in 2024 this paper considers the representativeness of candidates in terms of just the 49 Origins sub groups and the 12 Origins groups.
When associating an election candidate with an Origins category the Origins software application makes use of both the candidate’s personal and family names. In many cases the Origins classification of both elements of the candidate’s name are the same. Where the two elements of the name are associated with different Origins categories the application uses a pre-calculated confidence score given to each name element to identify whether, for any individual, it is their personal name or their family name which is the more predictive of their heritage. In the majority of instances it is the family name which is the more diagnostic. Whichever element of the name is the more diagnostic is the one used to classify the individual.
Due to issues involved in accurately comparing parliamentary representation with that of the UK adult community figures for Origins category “Black Caribbean” have been excluded from the definition of “Non white British”.
Unlike survey based classifications Origins does not contain a category for mixed heritage.
In order to establish the degree of over- or under- representation of different sub-populations the application compares the distribution of Origins codes on the file being analysed with the distribution of Origins codes on a near universal master file containing the names of virtually all adults (aged 18 or over) resident in the UK in April 2024.
Accordingly the Origins classification was used to code the 4,515 candidates standing for election in seats other than Chorley where by tradition the speaker is unopposed.
Just four of these could be coded, for reasons that are all too clear in table three.
| Constituency | Party | Personal name | Family name |
|---|---|---|---|
| Crewe and Nantwich | Monster Raving Loony Party | Lord Psychobilly | Tractor |
| Hackney N and S Newington | Independent | Kombat | Diva |
| Richmond and Northallerton | Count Binface Party | Count | Binface |
| Stoke-on-Trent Central | Independent | AliRom | Alirom |
Table three: Candidates whose names could not be recognised on the Origins reference files
How does the profile of MPs match the profile of the resident adult population?
Of the 650 MPs elected in 2024 555 had names suggesting a white British or Irish origin, 39 a non British white origin and a further 56 a non white origin.
Comparing the distribution of MPs names with those of the country’s adult population we can see that the white British community continues to be over-represented. For every hundred white British MPs that would have been elected were all communities to be precisely mirrored in the House of Commons there are altogether 106. Non white MPs fall below their proportion of the UK population by 17% but it is the other white community, mostly from elsewhere in Europe, that are the least likely to be returned to Westminster..
| Origin | MPs elected | % MPs elected | % UK adults | Index (Ratio of % MPs to % Adults) |
|---|---|---|---|---|
| British | 555 | 85.4 | 80.2 | 106.4 |
| Other White | 39 | 6.0 | 9.2 | 65.5 |
| Non White | 56 | 8.6 | 10.4 | 82.9 |
| All MPs | 650 | 100.0 | 100.0 | 100.0 |
Table four: Representation of key groups in 2024 UK parliament
Within the group “Other White” the shortfall of MPs is greatest among communities arriving in Britain from that part of Europe which before the fall of the Berlin wall had no recent experience of western parliamentary democracy.
The overrepresentation of MPs from the Welsh and Irish communities in the 2024 parliament is a consequence of the extreme number of seats won by Labour. Table two shows that these communities have been over-represented on the Labour benches at least since 1945.
The Jewish community is the most overrepresented.
South Asians and West Africans are minority groups which by 2024 have achieved parity of representation, their number in the house matching the number that would be implied by their size in the country as a whole.
Which communities are most engaged in terms of participation?
In the 2024 general election a total of 4,515 candidates stood for constituencies other than the one in which the Speaker stood.
To understand the representation of Britain’s non white British population we need to compare the distribution of candidates by Origins with the distribution of the total adult population by Origins.
Table five differentiates the 4,515 candidates according to whether their names indicates a white British or Irish heritage, whether a white heritage from elsewhere in Europe or whether they have a non-white, non British heritage.
Overall it is evident that by 2024 Britain’s non white British population is no longer materially inhibited by racism or lack of confidence from standing for parliament. The 11.6% of candidates of non white heritage exceed the 10.6% of adults of non white heritage by a margin of almost ten percent. As with Members the population that is underrepresented among candidates is once again the population that bears white names from continental Europe, a group many of whose members may have arrived in Britain relatively recently and who belong to communities less active in using politics to address community concerns.
| Origin based on name | % candidates | % UK adults | Index |
|---|---|---|---|
| British | 82.10 | 80.21 | 102.4 |
| Non British White | 6.16 | 9.16 | 67.2 |
| Non British Non White | 11.65 | 10.63 | 109.6 |
| 100.00 | 100.00 | 100.0 |
Table five: Representation of key communities - candidates
These broad grouping conceal consideration variations in levels of engagement with the democratic process with tables six and seven showing communities with the highest and lowest likelihood to stand as a parliamentary candidate.
| Rank | Origin based on name | % candidates | % UK adults | Index |
|---|---|---|---|---|
| 2 | IIZ : KASHMIRI AND AFGHAN | 2.17 | 1.11 | 195.7 |
| 3 | IHZ : PAKISTANI | 1.82 | 1.04 | 174.8 |
| 4 | IKA : BANGLADESHI | 0.62 | 0.38 | 165.3 |
| 5 | JAA : SIKH | 0.84 | 0.57 | 147.1 |
| 8 | KAA : HINDU INDIAN | 1.66 | 1.36 | 122.0 |
| 12 | KBA : TAMIL OR SRI LANKAN | 0.29 | 0.36 | 79.4 |
Table six: Representation of South Asian communities - candidates
Cleaarly both geography and religion are important factors in determining participation levels. Across the various South Asian communities there is much greater participation among Muslims than among Hindus and Sikhs with Tamils / Sri Lankans being strong outliers, a group particularly unlikely to stand for election. Among South Asian communities participation rates seemingly inversely correlation with level of economic success. Here, though not necessarily elsewhere, social and economic integration does not appear to be a forward predictor of greater political engagement. Quite the reverse.
Thus notwithstanding the participation among the various South Asian Muslim communities is very much higher than among Muslims with Middle Eastern or African heritage such as Iranians, Turks and North African Muslims, the exception being Somalis.
| Rank | Origin based on name | % candidates | % UK adults | Index |
|---|---|---|---|---|
| 18 | LBB : CANTONESE CHINESE | 0.18 | 0.32 | 55.6 |
| 19 | LBA : MANDARIN CHINESE | 0.09 | 0.17 | 52.5 |
| 20 | HZZ : OTHER BLACK AFRICAN | 0.18 | 0.35 | 50.3 |
| 21 | IFA : IRANIAN | 0.09 | 0.23 | 38.0 |
| 22 | HED : ETHIOPIAN | 0.02 | 0.06 | 35.6 |
Table seven: Non European communities with the lowest levels of representation - candidates
The results of the analysis confirms a pattern found I previous studies of candidates both in the US and UK of a lack of interest in standing for office among the two Chinese communities, Cantonese and Mandarin, though not to the same extent as in previous elections. Not a single member of the Vietnamese community stood for parliament.
The shortfall of candidates from continental Europe is particularly pronounced among the Eastern European communities and among Hispanics (CAA : SPANISH) whereas, as has been apparent in general elections since 1945, people of Jewish or Armenian heritage are particularly present themselves to stand for election.
| Origin based on name | %candidates | % UK adults | Index |
|---|---|---|---|
| GAA : JEWISH | 0.40 | 0.20 | 201.9 |
| GBA : ARMENIAN | 0.04 | 0.02 | 196.5 |
| DDA : GERMAN | 1.22 | 0.99 | 123.5 |
| DHA : ITALIAN OR MALTESE | 0.84 | 0.97 | 86.5 |
| FAZ : GREEK OR GREEK CYPRIOT | 0.24 | 0.30 | 82.1 |
| CCA : PORTUGESE OR BRAZILIAN | 0.44 | 0.55 | 80.6 |
| EKA : HUNGARIAN | 0.24 | 0.30 | 79.9 |
| DCA : DUTCH OR FLEMISH | 0.49 | 0.62 | 79.1 |
| DZZ : SCANDINAVIAN | 0.27 | 0.35 | 76.7 |
| DAA : FRENCH OR WALLOON | 0.55 | 0.74 | 74.7 |
| EPZ : RUSSIAN OR UKRAINIAN | 0.22 | 0.51 | 43.4 |
| EJZ : CZECH OR SLOVAK | 0.11 | 0.28 | 39.3 |
| EMZ : FORMERLY YUGOSLAV | 0.07 | 0.17 | 38.5 |
| EIA : POLISH | 0.47 | 1.22 | 38.2 |
| CAA : SPANISH | 0.29 | 0.79 | 36.4 |
| ELZ : BALTIC STATES | 0.09 | 0.36 | 24.9 |
| EOA : ROMANIAN | 0.16 | 0.67 | 23.1 |
| EMF : ALBANIAN | 0.02 | 0.13 | 17.6 |
Table eight: European communities by level of participation - candidates
In summary whilst the evidence suggest that the participation gap between white British and other groups that has been a matter of concern since the 1960s has now been very significantly narrowed, a clear pattern is emerging of very different levels of participation with communities arriving from former British colonial administrations bringing with them a stronger awareness of benefits that can be achieved through engagement with the democratic press with previous experience of living under authoritarian regimes.
The evidence also suggests, perhaps more tentatively, that individuals from some communities whose members have been more successful participation in the formal economy have had comparatively less motivation to achieve benefits through political engagement. The Chinese, Tamils and Greek Cypriots are good examples of such groups, those who have suffered a holocaust, the Jews and Armenians, are not.
Participation via mainstream political parties or as independents
2024 saw a further decline from its high point in 1945 of candidates of Irish heritage within the Labour Party. In 2024 both the Liberal Democrats and the Green had more candidates of Irish heritage did Labour.
However Labour continued to put forward a high proportion on non white candidates, 12.8%, three times the proportion of Reform, 4.11%. Of all the parties Reform was the most likely to select a candidate with an English name, 68.3% against a national average of 58.3%.
Candidates with non white, non British names were particularly likely to stand as independents, more so than for parties other than the mainstream ones.
It could be argued that the over-representation of certain communities among candidates occurs in two rather different situations, one where candidates choose to stand, or are chosen to stand, because they or the community they belong to wants to communicate a political message, the other where they are seeking votes to build a sufficiently solid base to advance a political ideology or point of view.
Balancing these two motivations a not unuseful measure of the influence different minority groups can have can be formulated in terms of the aggregate size of the votes that candidates from that minority achieved as a result of standing compared with aggregate size of the community. This measure is calculated by weighting the proportional number of candidates from a community by the average number of votes cast for members of that community.
Here we find that the communities with the largest share of the vote in relation to their population size were the Jewish and Armenian communities, around three times their share of the adult population. This level of support is some ten times that of members of most Eastern European communities, typically 10-25%.
There is a clear pattern with communities from former members of the British Empire using the democratic process far more effectively than communities from other parts of the world. This is evident when we contrast the overall share of the vote achieved by candidates of South Asian heritage is some four times as high as for people with East Asian names on a per person basis. Similar differences are evident in Africa where the votes for Britons of Nigerian and Ghanaian heritage are proportionate to their presence in the national population whereas those from other black African countries and from North Africa are very poorly represented.
In summary it would seem that in 2024 not all communities participated in the UK’s democratic process in a similar way. Some, as we have seen, are more willing to stand for election than others. Some are more likely than others to seek nomination as a candidate of one of the main parties. When they seek nomination some are more likely to win election whether because they stand in safer seats or, as in 2024, stand for a more electorally successful party. Taking all these factors into consideration we can compare communities in terms of their overall share in the number of candidates, in terms of the share of successful candidates and the share of total votes cast.
Whilst there are strong patterns between the relationship between heritage and candidacy these patterns are highly nuanced as between different groups, not just in terms of whether they stand, whether for an established party or as an independent and if for an established party which one it is. Programmes designed to achieve better representation of minorities on the ballot paper and in Westminster need to consider the very different backgrounds, aspirations and values of each different community.
| Origin of name | Actual MPs | If based on share of adult population | Surplus (+) or Deficit (-) | Index of Representation |
|---|---|---|---|---|
| Anglo Saxon | 421 | 406 | 15 | 104 |
| Scottish | 84 | 64 | 20 | 132 |
| Welsh | 40 | 40 | 0 | 99 |
| Northern Irish | 3 | 3 | 0 | 91 |
| Irish | 63 | 41 | 22 | 154 |
| European | 17 | 41 | -24 | 41 |
| Jewish | 5 | 1 | 4 | 430 |
| Black African | 2 | 6 | -4 | 34 |
| Asian and Muslim | 8 | 41 | -33 | 19 |
| All names | 643 | 643 | 0 | 100 |
Table nine: Index of representation at Westminster by Origin
The demise of a uniform national swing
Election night coverage of the 1959 election was in part memorable for its pioneering use of the “swingometer”. By averaging the share of the percentage gain or loss of the Conservative and Labour candidates in early returning constituencies the swingometer was able to project the final number of votes for each party by applying a uniform national swing to those seats that had yet to return their result.
The reliability of this projection depended on the validity of the swing being broadly uniform across different types of constituency and until 2024 this assumption had proved sufficiently reliable for overall forecasting purposes, notwithstanding the impact of third parties and occasional instances of special factors affecting the result in regions such as London and Scotland.
In the weeks running up to the 2024 election market research companies had their suspicious that any overall national swing might conceal widespread local variations and so it proved to be.
One contributor was the rise in the level of support for the smaller parties, the Liberal Democrats, Green, Reform and independent candidates all eating into the two party share.
A consequence of the larger number of close outcomes between mainstream and minor parties was the opportunity for tactical voting, often with the aim of unseating the incumbent party.
Another contributor was the changing demographics of the certain types of constituencies and the long term shift in the segments of the population from which they had become successful in drawing support, for example the appeal of Labour to relatively well-educated, economically successful workers in non-unionised service industries in thriving parts of the country.
Some degree of unevenness of the swing could be expected as a result of the war in Gaza and its weakening of support for Labour among minority communities, in particular Muslim ones.
As a consequence of this, despite its modest overall increase in its overall share of its national vote, and its poorer national showing than in 1983, 1966 and 1945, Labour Party candidates were returned for the first time since 1945 in a number of towns which the party had not succeeded in winning in 1966 or 1983 or in some cases even 1945.
One such group of towns are places which in 1945 would have been regarded as holiday seaside sorts but which over the years have found favour as affordable retirement resorts and residential areas and attractive locations for national service organisations. Towns which returned a Labour MP for the first time in 2024 include Bournemouth (two seats), Southend (two seats), Worthing (two seats), Folkestone, Southport and Weston-Super-Mare the last two having not long ago returned Liberal Democrats MPs. These towns have experienced significant juvenation during the past twenty years due to their availability of private rented accommodation and more affordable housing than in surrounding areas.
A second group of towns to return a Labour MP for the first time since 1945 or earlier are characterised by growing service and light industrial employment, mostly in the South East. These include Aldershot, Aylesbury, Banbury, Basingstoke, Bury St Edmunds and Leighton Buzzard. This group of towns are distinctive not only in that they are ones which Labour has never won but as ones which the Liberal Democrats have never been close to winning. It is in towns of this sort that have recently experienced a rapid influx of aspirational mobile members of minority communities, mostly second and further generation.
A third group of towns are small market towns serving sparsely populated areas of upland farming and modest incomes some of which had previously returned Liberal Democrat MPs. Before 2024 few pollsters would have pointed to Berwick on Tweed, Hexham, Liskeard, Penrith, St Austell and Welshpool as towns likely to be represented by Labour at Westminster.
In 2024 the changing demographic of Labour’s appeal enabled it to achieve victory in places it could not have predicted on the basis of a uniform swing but there were other types of seat which surprised commentators by swimming against the national tide, albeit in a different direction. These too conformed to a common demographic, namely the presence of a large ethnic minority population often largely South Asian Muslim.
Variations in swing by the size of the local South Asian community
| Threshold % of vote | Number of seats | Labour change 2019-24 (%) | Con change 2019-24 (%) | Reform change 2019-24 (%) | Lib Dem change 2019-24 (%) | Green change 2019-24 (%) | Other change 2019-24 (%) | |
|---|---|---|---|---|---|---|---|---|
| South Asian Muslim | ||||||||
| Bangladeshi Muslim | > 5% | 4 | -27.3 | -6.1 | 3.0 | -2.4 | 11.0 | 21.8 |
| Pakistani | > 5% | 24 | -27.8 | -11.1 | 5.9 | -4.0 | 6.6 | 30.4 |
| Kashmiri / Afghan | > 5% | 26 | -24.7 | -10.6 | 6.1 | -1.0 | 6.2 | 24.0 |
| All Muslim South Asian | > 15% | 17 | -30.1 | -10.6 | 6.0 | -0.8 | 6.2 | 29.3 |
| Other South Asian | ||||||||
| Sikh | > 5% | 13 | -10.3 | -16.5 | 10.0 | -0.8 | 4.1 | 13.7 |
| Hindu Indian | > 5% | 21 | -10.3 | -11.3 | 7.1 | -5.1 | -12.5 | 12.5 |
| Tamil / Sri Lankan | > 3% | 6 | -13.1 | -6.9 | 4.4 | -2.3 | 5.4 | 12.5 |
| Black African | > 5% | 21 | -8.9 | -20.5 | 5.0 | -2.3 | 10.4 | 4.4 |
| UK average | +2.2 | -20.5 | +12.5 | +0.4 | +4.3 | 1.1 |
Table ten: change in the share of the vote by presence of different communities
In 2024 “Other” parties, in other words parties other than Labour, Conservative, Reform, Liberal Democrat and Green, increased their share of the vote by 1.1% in UK constituencies on average.
Table nine shows how the success of “Other” parties varies depending on the mix of communities in a seat based on the Origins classification.
“Other” parties, including Independents, were particularly effective in attracting votes in the 17 seats where more than fifteen per cent of the electorate had South Asian Muslim names. In these seat Others improved their share of the votes cast by 29.3%. This compares with a national average improvement for Others of 1.1%. This increase in vote share was over twice the increase in the Other share of the vote in seats where people of either Sikh, Hindu Indian or Tamil/Sri Lankan origin comprised five per cent or more of the electorate nd over six times the increase in the 21 seats where more than five per cent of the electorate bear Black African names.
Within the Muslim South Asian community it seems that Independents and Other parties do even better in seats with large Pakistani communities than they do in seats with Bangladeshi or Kashmiris and Afghans.
The figures do suggest that in seats with large South Asian Muslim, Hindu or Tamil communities large increases in the Others vote comes disproportionately from the Labour vote. In many of these seats the voting shares of the Conservative, Liberal Democrat, Green and Reform candidates was already too low in 2019 to contribute to the success of ethnic candidates. Note that in seats with the largest Black African presence and where Others achieved relatively little support, the Conservatives lost ground to just as large a degree as they did across the country as a whole.
Comparing the experience of Labour candidates in seats with different mixes of minorities it could argue that the extent of the problem Labour faces in shoring up its vote can be traced to four issues of which the war in Gaza is only one.
The first, as we have seen from our analysis of the Origins profile of people standing for election, is that members of the South Asian Muslim population are particularly willing to stand for parliament, almost certainly with the support of other members of the community to which they belong.
A second consideration is the relative geographical concentation and social isolation of these communities, Origins data at postcode level reveals that South Asians are the most likely to segregate themselves geographically in Britain’s urban centres and, probably, as a result to have the weakest social and political links to the host population.
A consequence of this is that this community is particularly effective at mobilising its members, a process developed in local government before being applied in national general elections.
It might have been thought and it might once have been the case that the mainstream parties, Labour in particular, could capitalise on this features of the South Asian community by selecting members of these communities as their candidates. For example in the fifteen seats with the largest Muslim South Asian communities, Stephen Timms, Jess Phillips and West Streeting were the only three Labour candidates to bear a white British name. This strategy seems no longer to achieve the tractions that it once did.
| Constituency | Name of MP |
|---|---|
| Bradford West | Naz Shah |
| Birmingham Hall Green and Moseley | Tahir Ali |
| Bethnal Green and Stepney | Rushanara Ali |
| East Ham | Stephen Timms |
| Bradford East | Imran Hussain |
| Ilford South | Jas Athwal |
| Birmingham Perry Barr | Ayoub Khan |
| Dewsbury and Batley | Iqbal Hussain Mohamed |
| Birmingham Ladywood | Shabana Mahmood |
| Blackburn | Adnan Hussain |
| Birmingham Yardley | Jess Phillips |
| Poplar and Limehouse | Apsana Begum |
| Slough | Tan Dhesi |
| Stratford and Bow | Uma Kumaran |
| Ilford North | Wes Streeting |
Table eleven: Members rrepresenting seats with the highest proportion of Muslim adults
On the basis of this evidence it could be a mistake for the Labour Party to view the implosion of its vote in these South Asian Muslim seats as a one-off resulting from the support of the Labour Party for the Israeli military occupation in Gaza. Just as the Jewish vote, so solid for Labour in 1945, now divides equally between Labour and the Conservatives, there can be no certainty that seats with the largest non white British populations will necessarily last for ever as Labour heartlands.